Statistics
To get to the statistics screen, click on the pie chart icon in the upper navigation bar.

- You can view statistics for screens or content. Switching between these modes is available on the right side of the page navigation panel (tabs: For content, For screens).
- To view all statistics, click the Get report button. A file with statistics in .xlsx format will be sent to the Email address provided during registration.
- In the same panel, you can search for a specific screen, a group of screens or a content unit. To do this, enter your query text in the search bar.

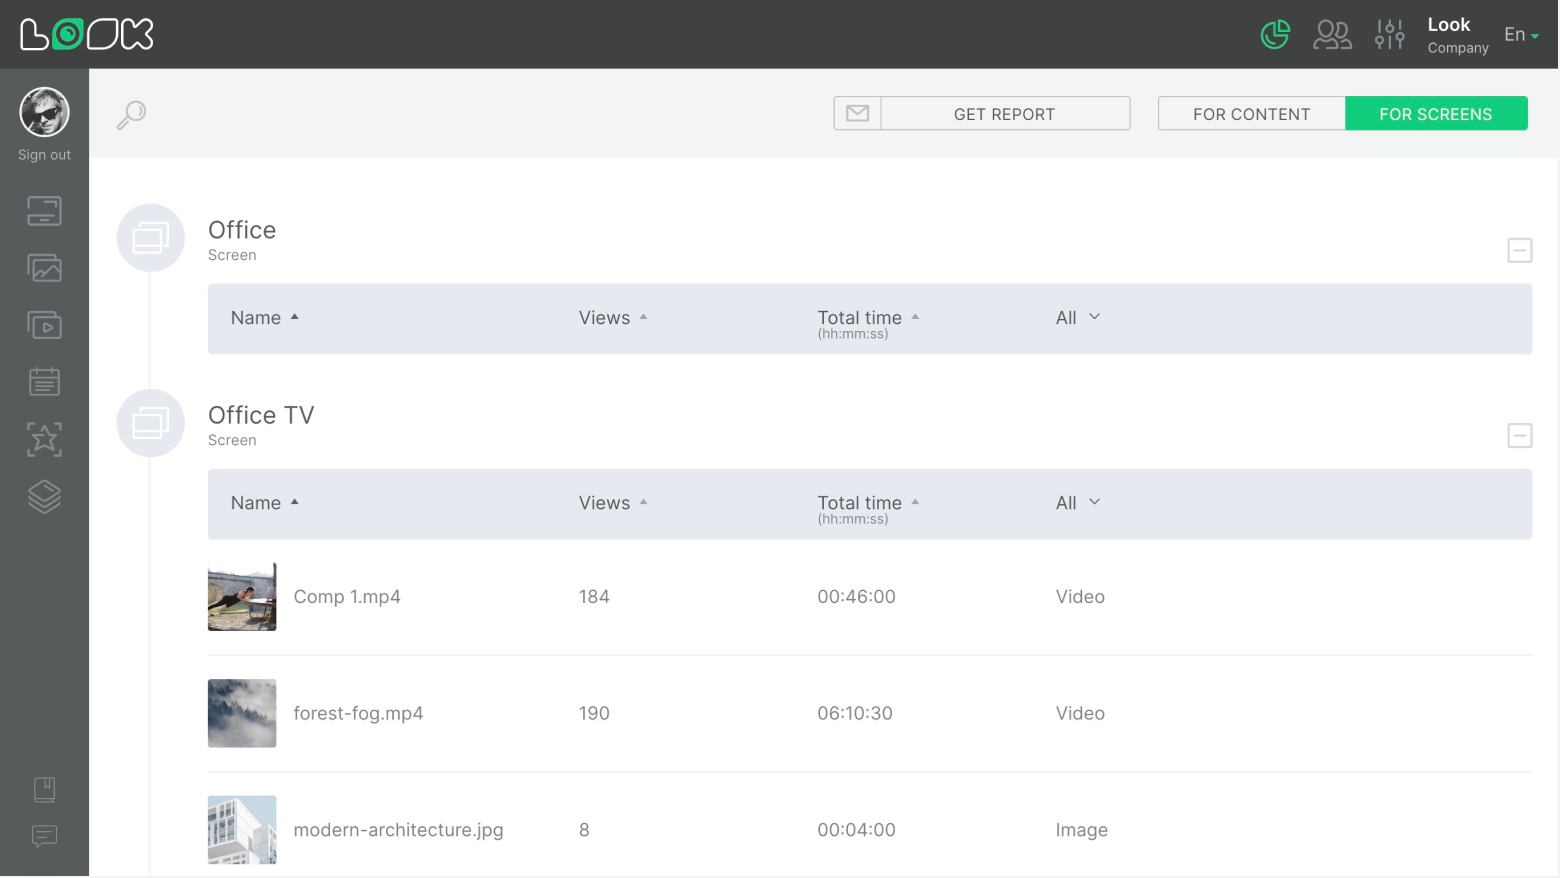
Screen Statistics
- You can view statistics of content playback for a single screen or a group of screens.
- All content that is on the screen is displayed in the form of a table, where you can see a preview of the content, its name, the total number of playback cycles on a specific screen, the total playback time on a specific screen, and the content type.
Content Statistics
- You can view general statistics of content playback.
- Statistics is presented in the form of a table, where you can see a preview of the content, its name, total number of playback cycles, total playback time, and content type.
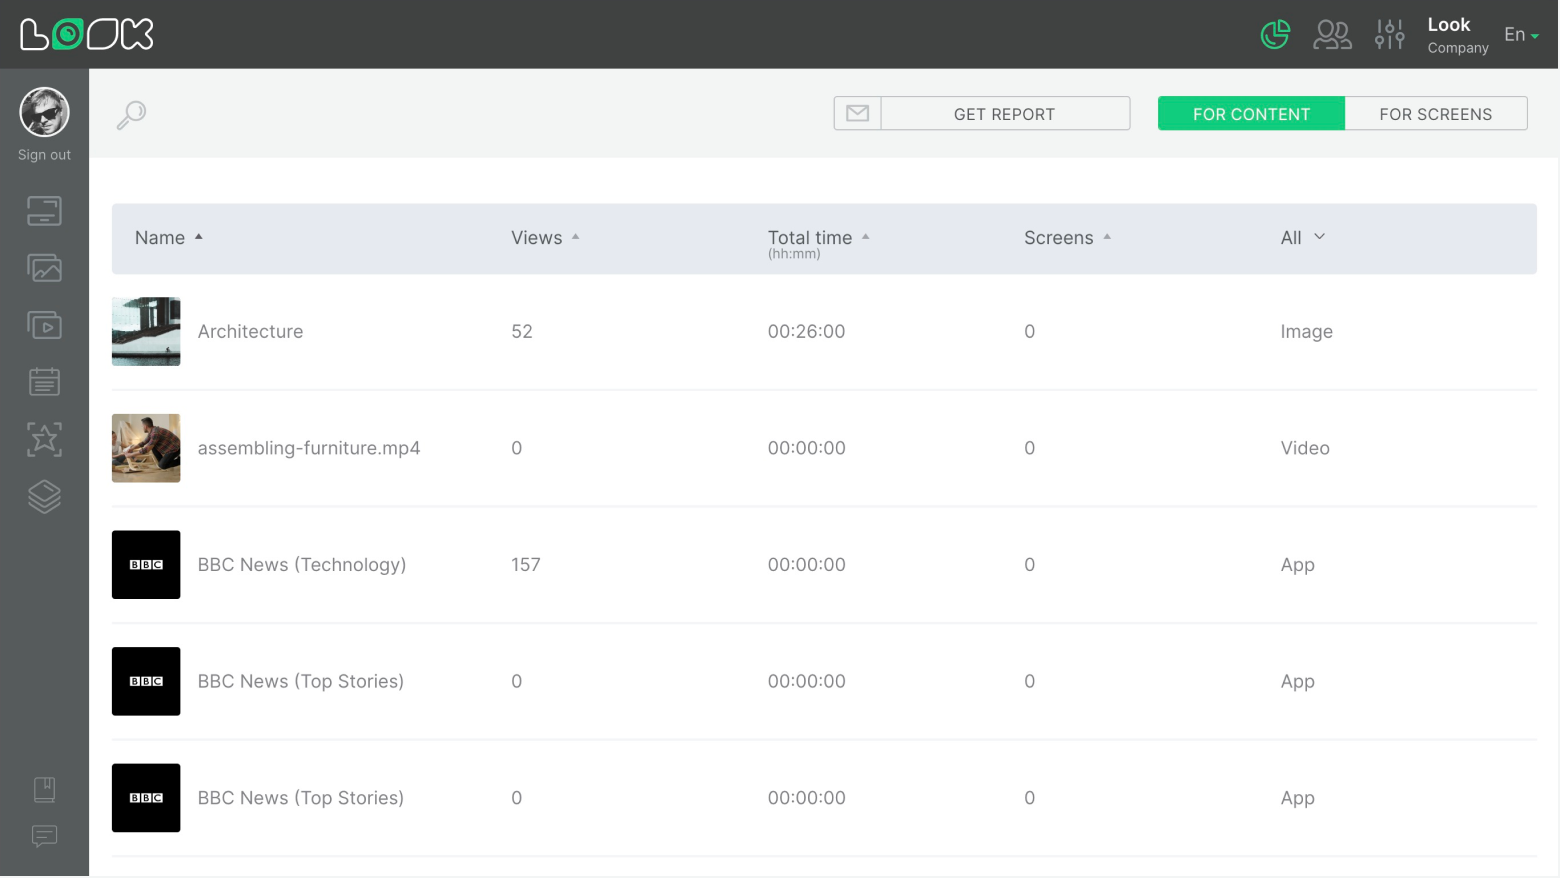
The table can be filtered by content name, number of playback cycles, total playback time, and content type. To do this, click on a an appropriate heading in the table header.
Can't find your answer?
Contact Support


